Presented at the SSSS National Meeting, November 5, 2010
We present alternative approaches for how results found in sexuality research are portrayed in our literature. Specifically, we propose the use of more graphic methods including the use of icon arrays instead of the routine portrayal using statistical methods (p<.05). Included also is a review of how our reliance on statistical error rates such as alpha, has often confused readers' interpretation of research findings in sexuality. We outline a new approach that incorporates both graphic methods as well as conventional quantitative techniques such as effect sizes (ES) and confidence intervals (CI). We do not suggest excluding p values in portraying sexuality results, only the possibility of evaluating other less-complex methods so that our varied constituencies can better understand, better interpret and thus act in a more informed manner on our research outcomes.
In 1713 Jakob Bernoulli formulated the Law of Large Numbers (LLN) (Huygens,1970).
This concept generally proposed that as the size of a researchers observations increased over time the probability also increased that the final result would be closer to the true (unbiased) value. Contemporary versions of this concept now refer to it as the “Law of Averages”. Shown in statistical notation it appears as:
[ > N (sample) > p (True Value) ]
Most social and behavioral scientists today intuit this phenomenon when they design their research studies. Sexuality scientists, at least those practicing from a quantitative paradigm, recognize the importance of “sample size” in their investigations. Figure 1 depicts this issue clearly. In panel A five sex therapy patients receive five increasing doses of therapy and their libido is measured. The result is linear and favorable: as the dosage increases their libido increases proportionately. In panel B the rest of the sample (N =75) is also administered the five increasing doses but their libidos do not receive the same result. Surely when sample N is larger and more inclusive the bias of previous result with only five patients is exposed.
Figure 1
While sample size is important type of sampling is also critical to researchers trying to collect data with minimum error (Bailey, 2007). If for example a sexologist randomly selected a large sample (i.e., N = 500) for a two-group study of a new sexual performance drug, the LLN’s suggests that absent of systematic error in measurement, the final results would be closer to the true value (lesser error) than if the sampling was for instance, 20 and nonrandom. Moreover if the results of this study showed that the new sexual performance drug group scored more favorably at posttest, then the sexologist would likely present the finding in a table highlighting this result. The standard way researchers across social and behavioral science tend to do this is to affix an asterick * next to the finding (i.e., experimental group score versus control group score). To finalize this presentation the investigator inserts p < .05 at the bottom of the table signifying the result is “statistically significant”.
Some researchers may boast their “success” even more by adding to the initial alpha: ** designating p < .01 and/or *** designating p < .001. Numerous recent studies in prominent sexual science journals include examples of this practice (Journal of SexResearch, 2010, v.47(1) ( pp.1-11; 92-102). An illustration of this redundant and unneeded practice with hypothetical data is shown in Table 1.
Knowledge 77 .041 *
Skill 88 .009 **
Behavior 82 .002 ***
___________________________________________
* p < .05 ** p < .01 *** p < .001
The debate over how and why statistical significance tests (SST) should used in research has been contentious since the 1960’s when Rozeboom stated “ significance testing is surely the most bone-headedly misguided procedure ever forced on the training of graduate students” (Rozeboom, 1960). Many other prominent scholars have since voiced their own concerns regarding the practice. There of course have also been strong supporters of the practice over the years ( Fleiss, 1986; Mulaik, Raju & Harshman, 1997)). Curiously at one point in the mid-1980’s the American Journal of Public Health proposed a moratorium on the inclusion of SST in submitted papers to the journal. Yet despite the vast array of arguments and proposals on how to resolve the dispute about SST, authors and journals have continued the practice of including alpha in papers.
As proposed recently (Duryea & Okwumabua, 2002) many authors not only rely on alpha to portray results as favorable but use erroneous language when describing non-significant results. In fact, many articles with findings that actually fail to reach p < .05 frequently describe the finding as “approaching” statistical significance, or that the result was “marginally” significant, that the outcome was in the “direction” of significance or even that the finding was on the “verge” of statistical significance (Thompson, 1998). One recent study examining the content of pro-eating disorder websites, stated that a finding “showed a trend toward” significance and then portrayed as the data: [70% v. 30%], Chi Square = 2.5, p = .10” (Borzekowski, Schenk, Wilson & Peebles, 2010). Curiously, the researchers had previously stated that p < .05 would be the study alpha ( p. 1227). Since the setting of a study alpha level is correctly established apriori, the .05 cutoff is either met or not and cannot “approach” statistical significance.
Scholars in sexual science may then find it curious how .05 became so entrenched when in fact it is a purely arbitrary cut-off level? Ronald Fisher, the father of modern day inferential statistics and for whom the F value is named in ANOVA calculations, is said by some to have been the first to proclaim .05 as the “level of a statistically significant result” (Fisher, 1925). It should be noted that Fisher’s original studies on this concept were in agriculture with manure as the “treatment” and “crop yield” as the dependent variable (Fisher, 1926). Regardless of the origins of this level many critics of SST continue to ask why p = .05 is proclaimed significant but p = .06 is not?
In any discourse dealing with technical procedure it is critical that definitions of key terms be specified. What does p < .05 actually mean ? One internationally respected professor of biostatistics has proposed that:
“The p value is the probability of being wrong when asserting that a true difference exists” (Glantz, 2002, p.108)
Stated differently, a p < .05 means that the result regarding the difference between a new sexuality education group versus the old sexuality education group, could be wrong 1 in every twenty trials of the same curricular experiment. If a reader sees a p < .01 in a summary results table, one can assume the probability of this difference being wrong is 1 in 100. In plain terms these cutoffs are simple error rates that quantify the probability of Type I errors (i.e., concluding a difference when there is none). Moreover as Cohen (1994 p.997) has stated, one of the major near-universal misconceptions related to seeing p is that it is the probability that the null hypothesis Ho is false”. Finally, the p value as a direct function of its purpose, cannot reflect the traits many authors erroneously ascribe to it: the fallacies of importance, strength and/or meaningfulness.
The Fallacy of Importance.
Importance is not a quality of simply seeing p < .05 next to a result. More precisely, a finding in science, including sexuality literature, is important when it adds to an existing body of knowledge. As the LLN suggests a study could easily meet the criterion of p < .05 by simply increasing N until the p value reaches < .05. A result is not deemed important simply because its many group-to-group comparisons are producing significant p values. Conversely, an outcome may be a new contribution to a fields research literature but may not even reach p < .05. To reiterate: a significant p value < .05 estimates the probability ones conclusion regarding a result could be wrong not how important the outcome is (Cohen, 1994, p.1001).
The Fallacy of Strength.
The magnitude or strength of a finding is not related to statistical significance. A recent sexuality study in a reputed journal reported a correlation coefficient of r = .113 as statistically significant (p < .05). Such a coefficient, however, is so small as to be of little value. Yet with an N of 119 even .113 can emerge as significant (Gay, 2002). If researchers wish to estimate the strength of a study effect, Effect Size (ES) or Omega Squared or other measures of strength should be used (Cohen, 1990). Sexuality researchers should be cautious in describing results that are “statistically significant “ (i.e., p < .05) but do not have ES measures presented along side. Cohen’s guidelines on the magnitude of ES and appropriate interpretation of “strength” are presented later.
The Fallacy of Meaningfulness.
A result can be seen as meaningful if it becomes useful or has an immediate benefit and relevance for specific users or populations (Tukey, 1969, p.89). If a new result can be shown to have relative advantage over the status quo then it is said too have utility or meaningfulness (Vaughan, 2007). For example, simply seeing that the Comprehensive Sexuality Curriculum reduced teenage pregnancies more than the Abstinence Only Curriculum (p<.05) is not equivalent to saying that this difference is meaningful to specific school constituencies. Parents with pro-abstinence views would certainly not find such an outcome meaningful. Shermer (2007) makes this clear in his review of pharmaceutical company decisions to stop publishing results from clinical trials because “consumers were not scientifically minded enough to understand” (p.32). As with myriad instances in public health, including sexual science, what is meaningful is relative.
In the final analysis concluding that an outcome is statistically significant at p < .05 only means there was less than a 5% chance the outcome could be wrong (i.e., the result was due to chance or the result of some other confounding factor). While quantitative researchers take comfort in seeing p < .05 emerge on computer printouts, they should not ignore the fact that a wide array of related procedures are available to help make portrayal of their results not only more clear but more effective to readers.
As the LLN’s suggests, as a researcher conducts multiple studies and secures progressively larger and larger samples, there will come a point where the difference detected between the experimental and control subjects will reach p < .05. The research issue however is not whether a difference is significant as much as whether it actually has importance, strength, scientific and/or personal meaning. As Berkson (1938) stated as far back as the late 1930’s:
“If we know in advance the p that will result from applying a statistical test to a large sample, there would seem to be no use in doing it on a smaller one” (p.527)
Moreover Goodman (1979) and others have consistently reminded quantitative investigators that a large difference in a small study or a miniscule difference in a large study, can produce the same p value. In essence, what the field of sexuality science requires is not a moratorium on SST but better ways to present data results to its eclectic constituencies. To this end I argue that alpha can be retained in data display but other formats and procedures be added to it to enhance clarity and information to readers. Considering the sophisticated technology currently available to sexuality science scholars this should be an exciting and worthwhile pursuit. Three propositions for improving how sexuality science research findings are portrayed follow.
Graphic Methods With “Icon Arrays”.
The first of these is to use graphic methods and raw data distributions of the research study to show more clearly what the results actually indicate. In such portrayals the pattern of the results is what readers need most, not statistical complexity (McKinlay & Marceau, 1999). An illustration of this approach is shown in Figure 2.
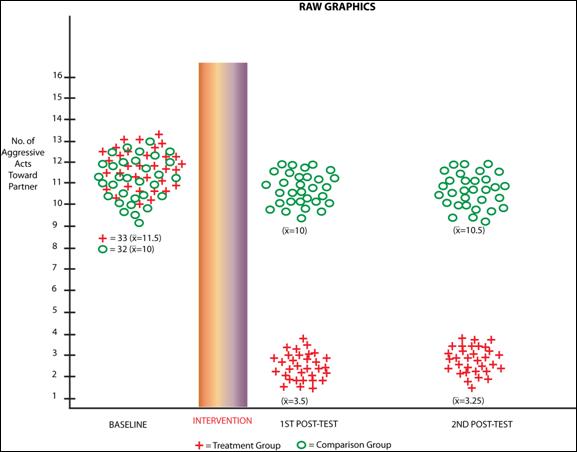
As Figure 2 shows the baseline scores for both groups cluster around an estimated mean of 11. While there is some normally expected variance in both groups scores, it is clear both groups are similar with regard to the major dependent variable: number of aggressive acts toward ones partner. There is little need here to run a statistical test to see if the scores are different at .05: they have nearly identical N’s and their means and variability are comparable. Still the prevailing practice in behavioral science and sexual science is to run the test and insert the p value regardless.
After the intervention has been implemented posttest 1 shows how the groups have performed. Clearly the intervention has had a favorable effect on the treatment groups’ behavior while the comparison group behavior has generally not changed. Simple means here again support the conclusion that the program has had the desired effect. There would be a tendency in most investigators training to run added statistical tests on this difference.
Finally at posttest 2, the data reflect retention of the program effect in the treatment group and no contamination or crossover for the comparison group. A final set of statistical tests at this data point would normally be conducted and would no doubt be “statistically significant”. The author may even use if available multiple p cut-offs (i.e., p < .05, .01, .001, .0001) to reinforce the positive nature of the study effect. Yet the graphic display of these findings over 3 waves of data collection belie the need to add further statistical complexity where it is not really needed.
The Special Case of Icon Arrays.
Recent research has suggested that individuals with “low numeracy” skill (i.e., less ability to understand information that is quantitative in nature), can improve their comprehension of quantitative data by using “icon arrays” (IA). Icon arrays are visual figures that portray data patterns without statistical measures or rate comparisons (Garcia-Retamero & Galesic, 2010). Figure 3 presents one such IA for a new drug called Estatin. People with low numeracy skill comprehend the difference in mortality rates better when the IA is used relative to when just the mortality rates are presented (p. 2198-2199). While it may seem clear to most after basic division (i.e., 80/800 v. 5/100) that Estatin users have a lower mortality than non-users, people with lower numeracy skill may not wish to do the calculation. They do however appear to understand the pattern of results when just the individual data in the form of an IA is presented to them.
Sexuality investigators should consider icon arrays as a viable adjunct to data portrayal in their research reports. There is no standard for constructing these kinds of visual techniques. Creativity in designing them is completely at the discretion of the researcher.
From Garcia-Retamero & Galesic, 2010: Am J Public Health, V.99, No.12, p.2199.
The literature compiled by sexologists, sex therapists, sex counselors and sex education researchers over the past decade has been extensive. It is designed to be shared with an immense array of varied constituencies with the intent of providing state-of-the-art information on sexuality. This information is quite often technically and quantitatively sophisticated and is routinely presented along with statistical figures, notations and tablular data. Because these data are numeric in many cases people with low “numeracy” skills may frequently not understand what information is being portrayed (Duryea & Hrncir, 2009). Such individuals can benefit from more direct methods of presenting research results. A burgeoning amount of research is starting to appear in literature in which complex statistical formulations and tests are omitted in favor of graphic methods such as icon arrays (Garcia-Teamero & Galesic, 2010). Consumers of sexuality research information can benefit substantially if investigators consider the use of graphic methods along with the standard quantitative techniques (i.e., p < .05). We have not argued in this paper for the removal of statistical measures in sexuality research. Providing p levels whether .05 or .01 or even .001, help readers interpret the probability a result could be due to chance or some uncontrolled confounding factor. We only propose that these traditional approaches be used in complement with the other less complex approaches outlined. It is our hope that given the vast and inherent creativity researchers in human sexuality possess, that innovative combinations of all these approaches can be tested and shown to be helpful to all those who read our research literature.
Bailey, K.R. (2007). Reporting of sex-specific results: A statistician’s perspective. Mayo Clinic Proceedings, 82: 158.
Berkson, D. (1938). Some difficulties of interpretation encountered in the application of the Chi Square Test. Journal of the American Statistical Association, 33: 526-542.
Borzekowski, D., Schenk, S., Wilson, J., Peebles, R. (20100. E-Ana and e-Mia: A content analysis of pro-eating disorder web sites. American Journal of Public Health, 100(8): 1527(-1529).
Cohen, J. (1988). Statistical power analysis for the behavioral sciences. Hilldale NJ: Lawrence Earlbaum.
Cohen, J. (1994). The earth is round: p < .05. American Psychologist, 49: 997-1003.
Cohen, J. (1990). What I have learned (so far). American Psychologist. 45: 1304-1312.
Duryea, E., Hrncir, S. (2009). An exploratory study of young people’s sexual numeracy proficiency. Scientific Proceedings of the Ninth Meeting of the National Social Science Association, V.12, No.77, pp.711-721.
Duryea, E., Graner, S., Becker, J. (2009). Methodological issues related to the use of p < .05 in health behavior research. American Journal of Health Education, 40(2): 120-125.
Duryea, E., Okwumabua, J. (2002). Erroneous use of causal language in health behavior research. American Journal of Health Behavior, 26: 221-228.
Fisher, R. (1925). Statistical methods for research workers. Edinburgh: Oliver & Boyd.
Fisher, R. (1926). The arrangement of field experiments. Journal of the Ministry of Agriculture. 33: 503-513.
Fleiss, J. (1986). Significance tests have a role in epidemiologic research: Reactions to A.M. Walker, American Journal of Public Health. 76: 559-561.
Garcia-Retamero, R., Galesic, M. (2010). Communicating treatment risk reduction to people with low numeracy skills: A cross-cultural comparison. American Journal of Public Health. 99(12): 2196-2202.
Gay, R., Mills, G., Airasian, P. (2006). Educational Research. (8th Edition), Upper Saddle River, NJ: Pearson Merrill Prentice Hall.
Glantz, S. (2002). Primer of Biostatistics. New York: McGraw-Hill, 106-110.
Goodman, S., Royall, R. (1988). Evidence and scientific research. American Journal of Public Health. 78: 1568-1574.
Huygens, C. (1970). On Reasoning in Games. In J. Bernoulli, F., Maseres, (eds.). The Art of Conjecture. New York: Redex Microprint, (Originally Published 1657).
Journal of Sex Research (2010). Selected articles. Vol. 47(1): 1-11;92-102.
McKinlay, J., Marceau, L. (1999). A tale of 3 tails. American Journal of Public Health, 89: 295-298.
Mulaik, S., Raju, N., Harshman, R. (1997). There is a time and place for significance testing. In LL Harlow, SA Mulaik & JH Steiger (eds.), What if there were no significance tests? Mahwah NJ: Lawrence Earlbaum, 65-115.
Rozeboom, W. (1960). The fallacy of the null-hypothesis significance test. Psychological Bulletin, 57: 416-428.
Shermer, M. (2007). Airborne baloney. Scientific American, 32: 32-33.
Thompson, B. (1998). Five methodological errors in educational research: The pantheon of statistical significance and other faux pas. Paper presented at the Annual Meeting of the American Educational Research Association, San Diego, Ca., April 15.
Tukey, J. (1969). Analyzing data: Sanctification or detective work? American Psychologist, 24, 83-91.
Vaughan, R. (2007). The importance of meaning. American Journal of Public Health, 97: 592-593.